[1] 17Functionals
2026-02-03
Functionals
Functionals are functions that take a function as input and return a (vector of) number(s) as output:
in base: e.g. uniroot, integrate, …
in tidyverse: e.g. summarize, mutate, …
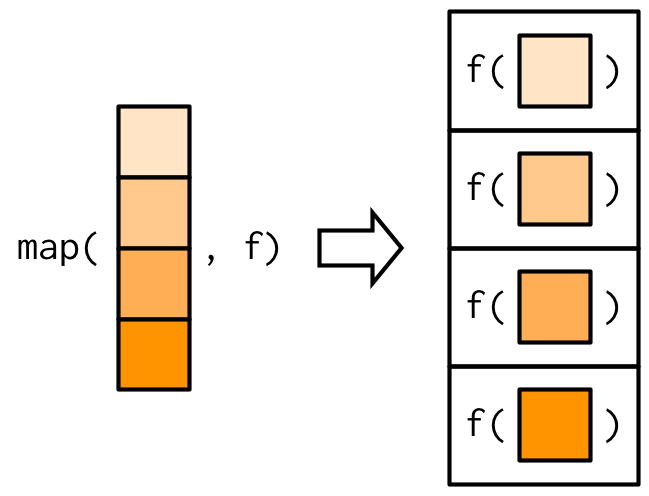
another example: purrr::map applies a function on every element in a list
Using functions …
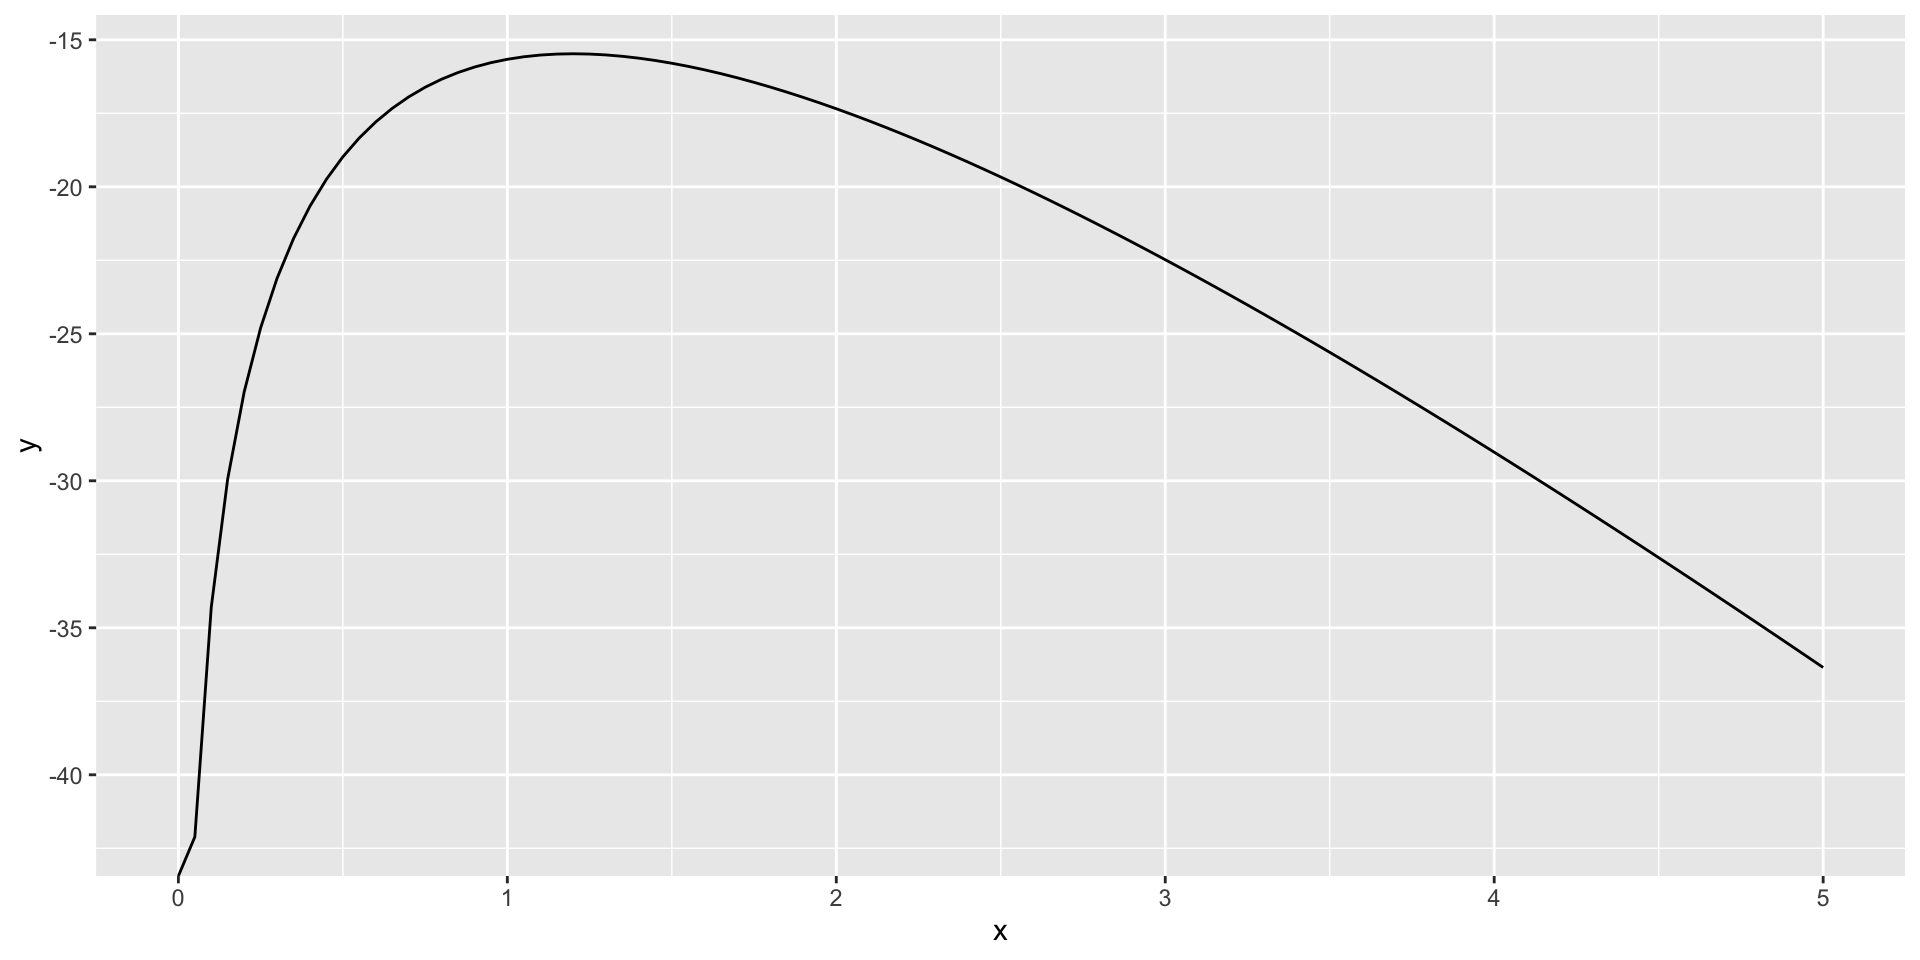
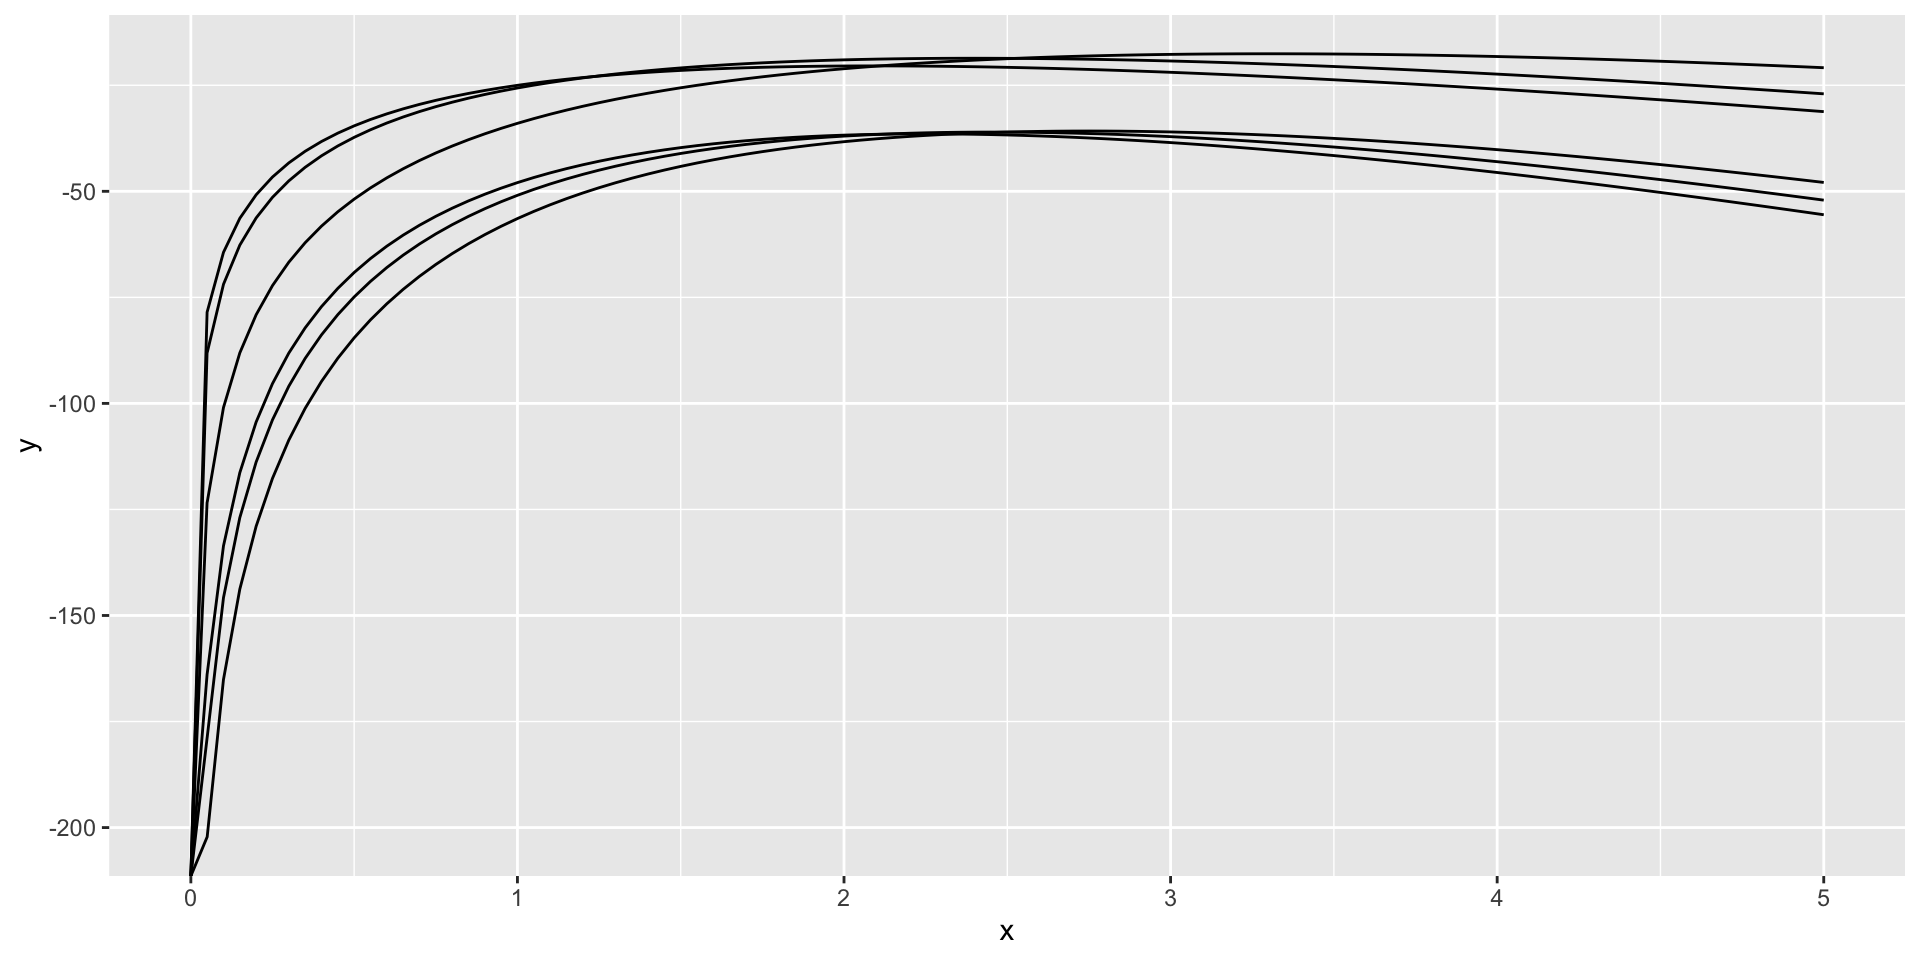
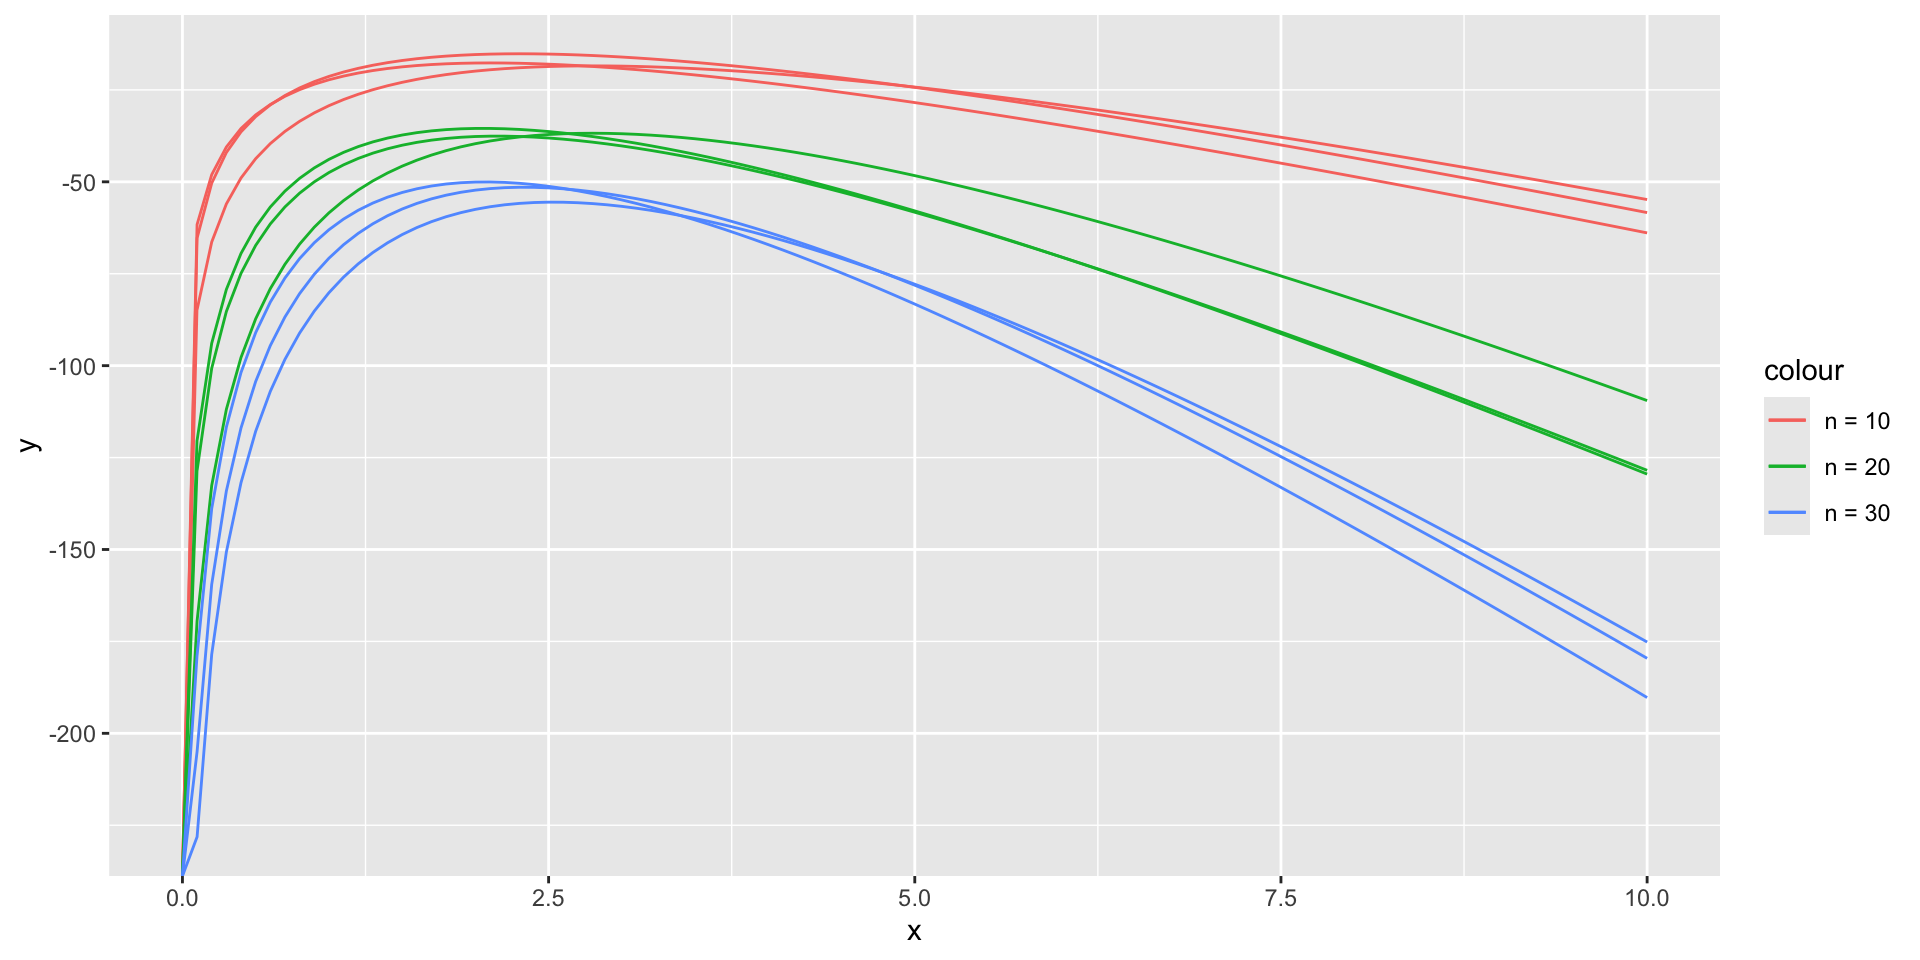
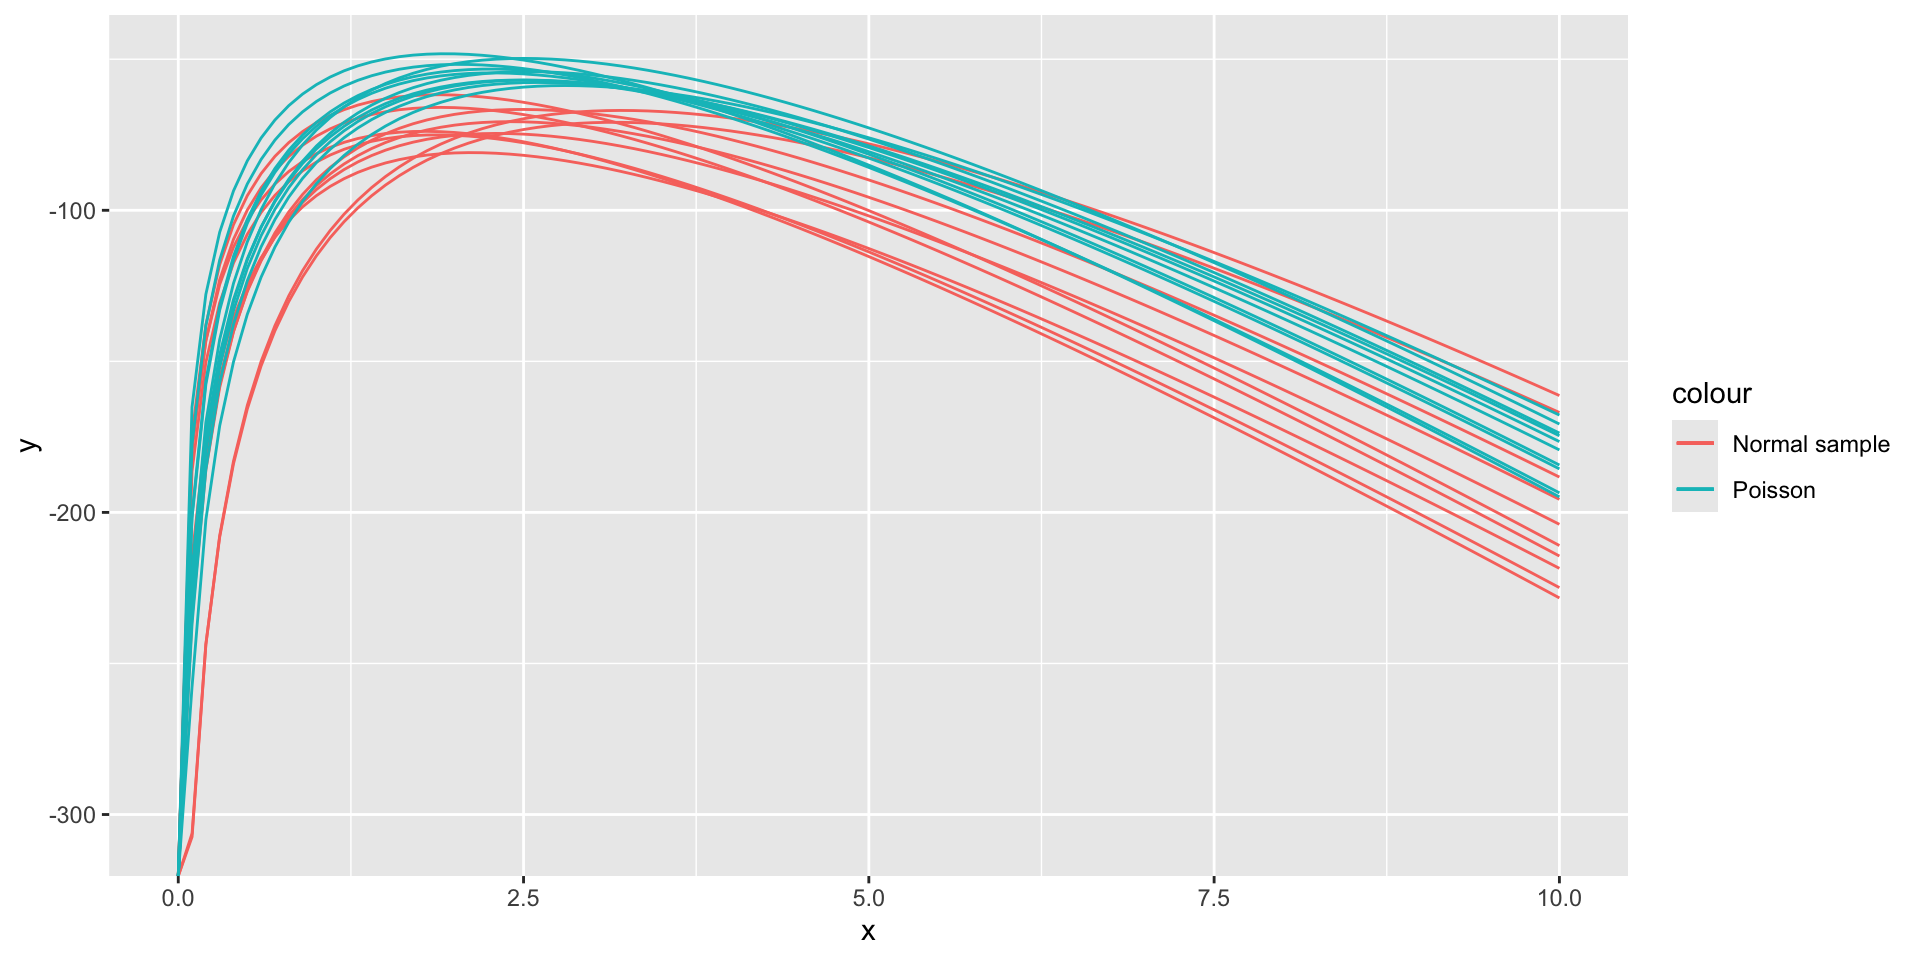
Sampling error in log-likelihood functions
ggplot() +
  geom_function(fun = ll_poisson(rpois(10, lambda)), xlim = c(0, 5)) +
  geom_function(fun = ll_poisson(rpois(10, lambda)), xlim = c(0, 5)) +
  geom_function(fun = ll_poisson(rpois(10, lambda)), xlim = c(0, 5)) +
  geom_function(fun = ll_poisson(rpois(20, lambda)), xlim = c(0, 5)) +
  geom_function(fun = ll_poisson(rpois(20, lambda)), xlim = c(0, 5)) +
geom_function(fun = ll_poisson(rpois(20, lambda)), xlim = c(0, 5)) 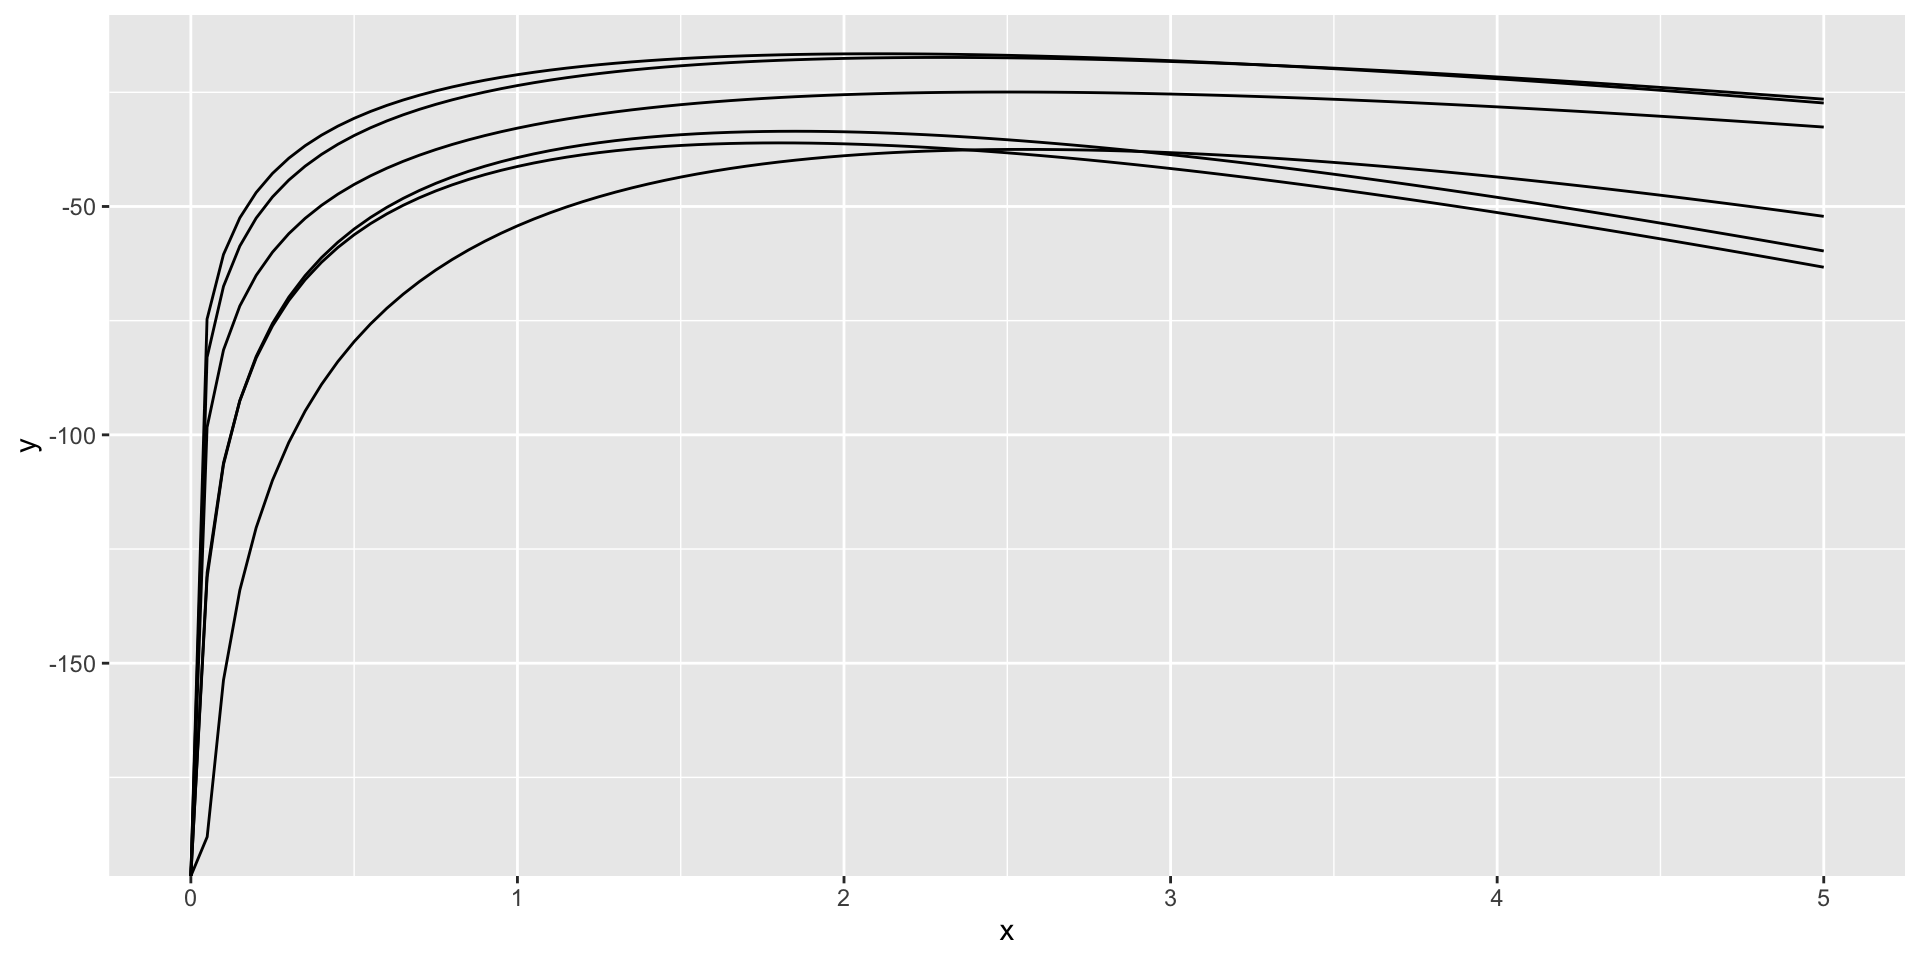
Solution - mapping