x <- sample.int(4, size=100, replace = TRUE)
y <- vector("character", length=length(x))
for (i in 1:length(x)) {
   y[i] <- switch (x[i], "Sun", "Rain", "Snow", "Hail", default=NA)
}

table(y)
y
Hail Rain Snow Sun
24 25 28 23 2026-03-26
Violation of the language model
for loops should be used sparingly,rbind (it is known to be very slow)Insufficient knowledge of the language. We’re all guilty of that at different levels
Reading other people’s code helps improve our language knowledge!
x is vector with numbers 1,2,3,4
Objective: re-code these into weather events: “Sun”, “Rain”, “Snow”, “Hail”
# the switch statement on the previous slide is equivalent to
# the following lines:
for (i in 1:length(x)) {
  if (x[i] == 1) y[i] <- "Sun"
  if (x[i] == 2) y[i] <- "Rain"
  if (x[i] == 3) y[i] <- "Snow"
  if (x[i] == 4) y[i] <- "Hail"
}

# using R's vector system we can reduce this to a single line:
y <- c("Sun", "Rain", "Snow", "Hail")[x]All of the previous solutions doctor around symptoms
We are still breaking the language model :)
Ken Thompson:
keep the number of indentations down, high number of local variables is suspicious
Hadley Wickham:
functions with more than ten lines are suspicious, as is highly repetitive code
Generally Good Practices:
structure code using indentation and spacing, write comments, use clear naming convention
Code can be profiled at different levels:
two (or more) alternatives of code with the same objectives are timed to determined the one which is the fastest (system.time() and proc.time())
one piece of code is analyzed to find weak/slow spots (e.g. profvis )
Collect information on code performance:
memory usage
frequency and duration of function calls
Goal: optimization of code
system.time() or proc.time()Probably simplest of all measures
Evaluates the time spent in the whole expression
doesn’t give any clues about what is done at a lower level
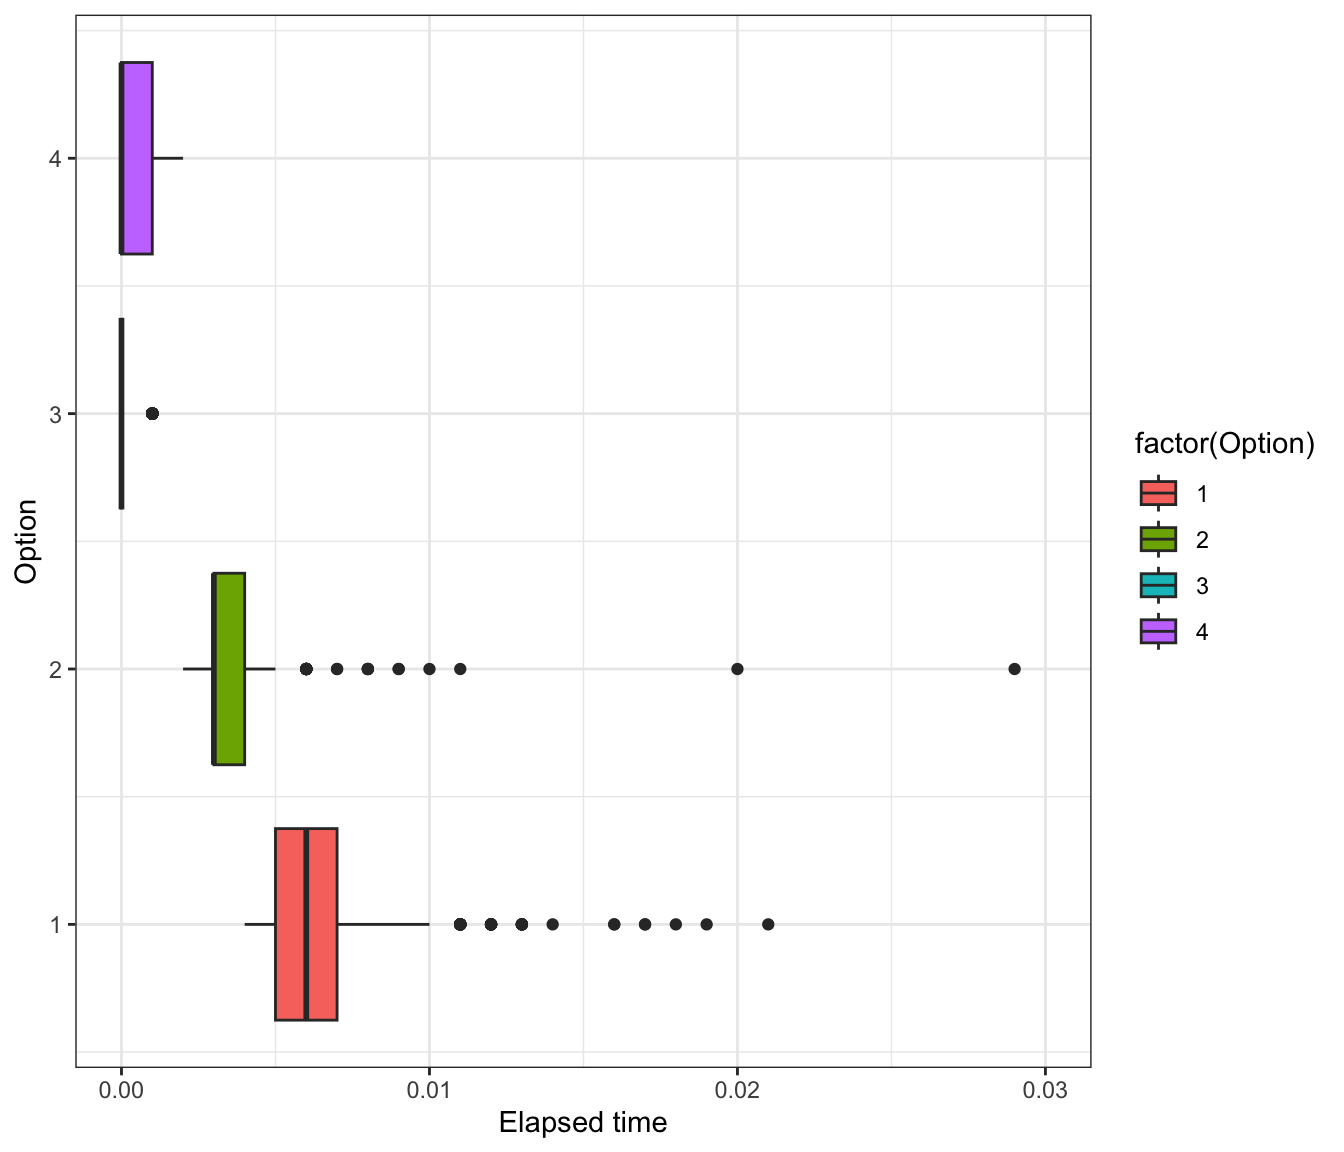
x <- sample.int(4, 100, replace=TRUE)
y <- vector("character", length=length(x))

# Option #1
for (i in 1:length(x)) {
   y[i] <- switch (x[i], "Sun", "Rain", "Snow", "Hail", default=NA)
}

# Option #2
for (i in 1:length(x)) {
  if (x[i] == 1) y[i] <- "Sun"
  if (x[i] == 2) y[i] <- "Rain"
  if (x[i] == 3) y[i] <- "Snow"
  if (x[i] == 4) y[i] <- "Hail"
}

# Option #3
y <- c("Sun", "Rain", "Snow", "Hail")[x]

# Option #4
y <- factor(x)
levels(y) <- c("Sun", "Rain", "Snow", "Hail")Option 3 is fastest on average. But why?
profvis package:
wrapper around function Rprof
call stack is written every 0.02 seconds (interval) into a temporary file
output file is processed to produce a summary of the usage
time measurements varies by platform: on Unix-alike time is CPU time of the R process (excludes time waiting for input)
Note: profiling takes time, too; once the timer goes off, the information is not recorded until the next timing click (probably in the range 1–10 msecs). Can’t go below that.
profvis exampleprofvis creates interactive response with code and flame plot.
Copy and paste the code into your console to run it.